By Joe Isenhower Jr. (joe.isenhower@lcms.org)
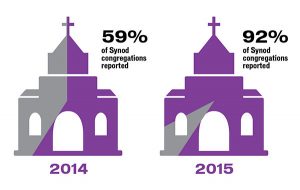
The 2014 statistics (as of Dec. 31) are in for LCMS congregations — with 92 percent of them reporting at least their baptized and confirmed memberships, as well as their average weekly worship attendance.
 That percentage is the highest annual rate of return for congregations reporting their statistics to the Synod’s Office of Rosters and Statistics in at least 15 years. It compares with 59 percent of congregations reporting for 2013.
The high return rate for last year means more accurate numbers, especially for those basic membership and worship-attendance statistics. The more accurate membership figures are good for determining delegate representation at next year’s LCMS convention in Milwaukee.
On the not-so-good side, those more accurate statistics for 2014 are down considerably from the year before in terms of the total baptized and confirmed membership in the Synod, with the worship-attendance average also down.
Total financial contributions recorded for congregations also declined from 2013 to 2014, as well as parish-education-related numbers. However, the number of “specialized ministries” conducted by congregations continued a trend of rising over the past several years.
The usual cutoff date of Apr. 15 for Rosters and Statistics to collect congregations’ statistical reports for the previous year was extended to Aug. 15 this year. And to meet that deadline, some 860 congregations reported only their baptized and confirmed membership, along with their average weekly worship-attendance numbers.
Accuracy for delegate selection
Referring to the 92 percent rate of return as “huge,” Synod Secretary Rev. Dr. Raymond L. Hartwig told Reporter “that’s very good,” especially for accurately determining “delegate representation to the convention.”
Hartwig explained that such accuracy comes into account when electing convention delegates from electoral circuits, which each “must have at least 1,500 confirmed members and fewer than 10,000 confirmed members, and should be made up of 7-20 congregations.”
When those membership counts “fall outside the requirements,” Hartwig said Synod Bylaw 3.1.2 specifies that circuits “have to think about either getting an exception from the president of the Synod or joining with an adjacent circuit to get the numbers right.”
He expressed thanks to congregations and to LCMS district presidents for their help encouraging congregations to report their statistics.
“But it’s amazing — as hard as everybody tried, that we still were lacking 8 percent of the reports” for 2014.
Scott Kostencki of Rosters and Statistics explained that although some statistics are “rolled over from the most recent years reported” for congregations that do not report their latest statistics, those statistics were not rolled over for the 860 congregations that reported their three membership and worship-attendance figures. He also said that “transactional” statistics are not rolled over — such as Sunday-school, confirmation-class and vacation Bible school attendance, as well as current specialized ministries (which are actually compiled from a separate questionnaire congregations submit each summer).
Kostencki added that 95 percent of all LCMS congregations have reported their statistics at least once in the past three years.
Caution: comparing statistics
Both Hartwig and Kostencki cautioned that it may not be valid to compare summary totals of statistics to those of the previous year. They indicated that is especially true when the percentages of reporting congregations vary so widely as they did for 2014 and 2013 (for which only 59 percent of congregations reported) and when taking into account rolled-over statistics and other variables.
Instead, they favor looking at trends suggested by statistics gathered over a number of years, which might be gathered from statistical tables that will appear along with other statistical information for 2014 in the 2016 Lutheran Annual. That edition is expected to be available by year’s end from Concordia Publishing House.
Reporter nonetheless is providing a comparative rundown — as it has done in years past — of combined reported and recorded congregational statistics for 2014 and 2013.
Starting with what may be the most accurate count for 2014, total baptized membership reported for that year is down by 66,440 (or 3.1 percent) from the number reported for 2013 — for a total of 2,097,258 at the end of 2014. Total confirmed membership decreased by 43,918 for 2014, to 1,641,679. And average weekly congregational worship attendance in 2014 declined by 14 percent from 2013 — from 154 to 132.
Financial statistics for 2014 indicate that reported giving at the congregational level for local expenses stood at $1,229,158,978, a decrease of $61,835,035 (or 4.6 percent) from the figure reported for 2013; and congregational giving for other purposes (or work at-large) in 2014 was $118,292,783, down by $10,400,368 (or 8.1 percent) from 2013.
Specialized ministries up
Increases in specialized ministries reported by congregations for 2014 include the total number of 48,637 that they conducted (up 531 from 2013).
Among those are 20,811 educational ministries (up 112 from 2013); 15,586 (up 222) human-care efforts; 7,685 (up 104) media efforts and 4,555 (up 93) “special-needs” ministries — such as for those with developmental disabilities, the elderly and armed-forces personnel.
Some 530 (up 39) congregations reported offering 1,124 (up 71) specialized worship services in 2014. They included 374 (up 26) serving language or ethnic needs and 750 (up 45) for those who are vision- or hearing-impaired.
Also up in 2014, compared with 2013, are official acts, including the number of baptisms and confirmations. For 2014, congregations reported that:
- 25,551 (up by 4,233) children were baptized.
- 18,585 (up 2,708) teenagers were confirmed.
- 14,856 (up 4,067) adults were confirmed.
Likewise increasing were the number of reported “professions of faith” (of lapsed members reinstated to congregation membership) in 2014, by 2,191 (26 percent), to 10,633.
However, the number of “back-door losses” (adults removed from congregations’ membership lists for reasons other than transfer or death) increased by 8,118 (26 percent), to 39,620.
Statistics reported for congregations’ Sunday schools and other classes declined for 2014, compared with 2013, as follows:
- 4,581 Sunday schools in 2014 (down 526 from 2013).
- 307,026 enrolled in Sunday schools (down 39,977).
- 1,236 weekday religion classes (down 138).
- 98,614 students in weekday religion classes (down 10,963).
- 19,504 non-members in weekday religion classes (down 2,445).
- 3,124 vacation Bible schools (down 394).
For 2013, all but two of those Christian-education-related figures rose, compared with those reported for 2012.
In addition to congregation reports, the 35 LCMS districts reported a total of 6,105 member congregations and new church starts at the end of 2014, compared with 6,136 a year earlier. The districts also reported the number of ordained clergymen serving in congregations was down by 103 at the end of 2014, to 5,575. Clergymen serving in other capacities at year’s end 2014 totaled 519 — 30 fewer than a year earlier; and the number of retired clergymen increased by 215, to 3,028. For the end of 2013, districts reported that the number of retired clergymen had increased by 67 from 2012.
Posted Oct. 27, 2015 / Updated Oct. 28, 2015


It’s good that you cautioned folks to be careful about comparing one year to the next when looking at summary numbers. Each year there are different sets of congregations reporting, especially between 2013 and 2014. As such, there will be decreases and even increases created simply due to the fact that some congregations reported in one year but not the other. As example, the decrease in Baptized Membership of 66,000+ would seem to be saying that’s an equivalent loss to having lost all of the Baptized Members in the New Jersey District, the Wyoming District, the Montana District, the SELC District, and about half of the New England District combined in one year. I would normally look at Average Attendance for this view, but it’s not really clear as to which congregations are included in the overall Average Attendance number listed in the article. Losing the equivalent of the smallest four and a half districts (based upon Baptized Membership numbers) is very concerning.