In the past, Reporter/Reporter Online annually carried a news story about the Synod’s statistical data for the previous year, based on reports from congregations that were compiled by the LCMS Office of Rosters, Statistics and Research Services. This year, instead, we are providing this commentary, in which data for 2015 is not only reported and compared with the previous year’s data, but presented with more background information and insight. — Editor
By John W. Sias
With each new year, the LCMS Office of Rosters, Statistics and Research Services reaches out to congregations to gather the previous year’s statistics. In about two-thirds of our congregations, some diligent soul typically tabulates the year’s births and deaths, baptisms, confirmations, transfers and so on, and responds — perhaps without another thought but, “Well, I’ve done my part for another Lutheran Annual.” Maybe the statistical form should come with a sticker saying so — a small reward, but it would be something.
A better reward for all this effort, though, is what the Synod can do with the data received. This goes far beyond a book on the shelf or even numbers in the popular online congregation locator — and could go farther, with greater congregational participation.
Fresh statistics are prized going into Synod-convention years, when congregational membership impacts delegate representation by electoral circuits (Bylaw 3.1.2). A Herculean effort in 2015 by former Synod Secretary Rev. Dr. Raymond Hartwig, his staff and the districts reaped data from 92 percent of congregations. Still, why not 100 percent? The very next year, despite all the recent encouragement, a more typical 71 percent reported. Fortunately, Dr. Hartwig offered parting encouragement that led to the 2016 convention’s clarifying in the Bylaws that the congregations expect one another, “as a condition of membership in the Synod,” to send in their data annually and expect district presidents and circuit visitors to “pursue unanimous participation” in this work (Res. 11-08A).

Unanimous participation would be a mark of our congregations’ godly interest in and concern for one another, and of their concern together that their Synod’s limited resources be allocated with the best guidance. This is a way for each congregation to help the Synod, in which each has invested so much, to help all its congregations as best it can.
The Rev. Bart Day, executive director of the LCMS Office of National Mission (ONM), noted that the data congregations submit is of immediate value. “As ONM is asked to share best practices across the Synod and connect and coordinate ministries in various districts,” Day said, “this data is critical. … We are able to track trends that can be shared across the church. It is one component that helps us with church planting and revitalization work.”
A look at the numbers
Roster-based facts are known with certainty. At the end of 2015, there were 6,101 member congregations and new church starts, down four from 6,105 the year before. Additionally, 5,524 parish pastors were serving at the end of 2015 (a decline of 51 from 2014) with another 525 clergy serving in other capacities (an increase of six).
Combining 2015’s responses with previous years’ information (95 percent of congregations have responded in the last three years) yields additional, statistically sound results.
That includes:
- baptized membership — 2,060,514 (down 36,744, or 1.75 percent from 2014).
- confirmed membership — 1,609,100 (down 32,579 [1.98 percent]).
- total contributions — $1.413 billion (up from $1.347 billion [4.89 percent]).
- contributions for local expenses — $1.289 billion (up from $1.229 billion [4.9 percent]).
- work at-large (including to district) — $124 million (up from $118 million [4.81 percent]).
Congregational membership continues its decline (though average attendance per congregation reporting was 141 for 2015, compared with 132 for 2014). The level of giving seems to be increasing at a rate outpacing both the loss of members and inflation. Encouragingly, that increase in giving is benefiting both local expenses and, in a similar proportion, the “at-large” work of the Church.
While the Synod has always tracked official acts of the congregation and membership gains and losses, spotty reporting means the year-to-year comparison of these sums tells more about response rate than it does about changes in the actual occurrences. The 71 percent of congregations responding did report the following for 2015: 23,800 children baptized; 16,830 teenagers confirmed; 14,147 adults confirmed; and 9,416 professions of faith. For more figures, refer to the “State of the Synod” article in the November Lutheran Witness. Even better, check the statistical information in the 2017 Lutheran Annual, which is expected to be available from Concordia Publishing House by Dec. 1.
Beyond the same old numbers
In 2007, Rosters and Statistics began to gather information on specialized ministries (human care, service to those with special needs, etc.) and special worship services (foreign language, hard of hearing, American sign language, etc.) in congregations. These ministries continue to increase. As of 2015, congregations have documented an astounding 49,121 current specialized ministries (an increase of 484) and 1,147 specialized worship services (up 71 from the previous year).
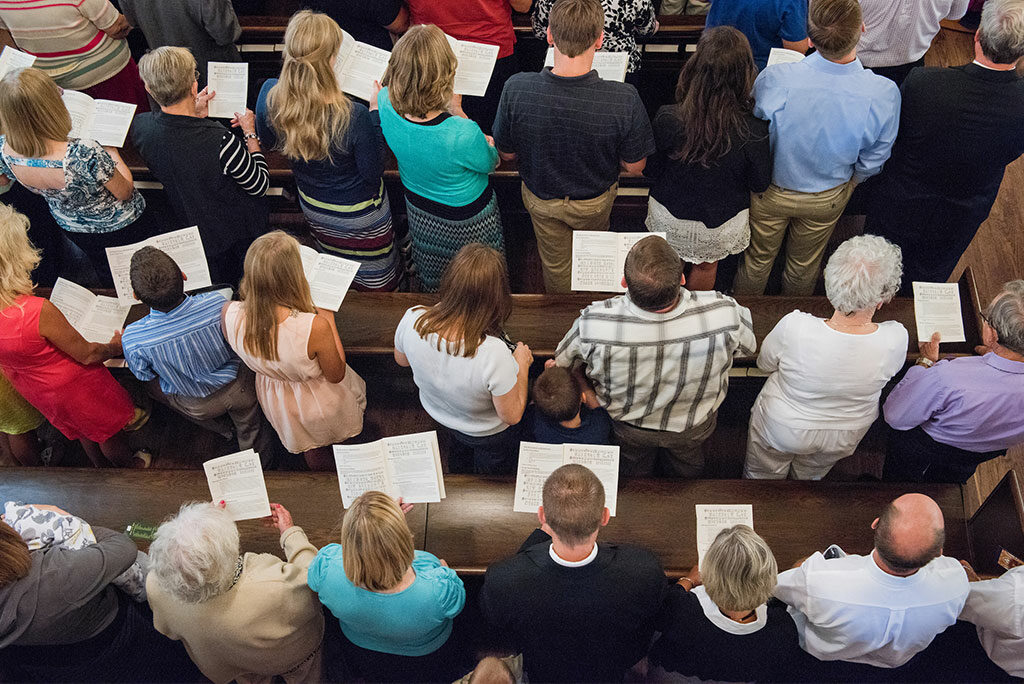
Since 2012, Rosters and Statistics — responding to the frequent question, “How old are the people in our pews?” — has asked congregations to report on membership by age bracket. With a few years’ reporting under our belts, a statistically confident answer is emerging. The average age of an LCMS baptized member in 2015 was 47. Compared to U.S. Census estimates, our congregations are disproportionately long on seniors 65 and older (they make up 24 percent of total baptized membership) and short on young adults ages18–34 (15 percent). Baby Boomers and Generation X adults (20 percent and 17 percent, respectively) are roughly proportional to the general population.
There is interesting good news, though. Congregations report having a greater-than-would-be-expected proportion of children (nearly 1 in 4 of all baptized members are under 18). Doing better than we have done to help them “grow in stature” with us in the faith — that is the challenge (witness the now “missing” 18–to-34-year-olds). Annual reporting from all our congregations will help us understand how that’s going in each place, and help us, through the Synod, help one another at it.
Looking forward
With 2015’s data collection and validation complete, data analysis is underway. In January 2017, the collection of 2016’s data will begin.
Online reporting of statistics has made data collection easier, allowing Synod staff more time to focus on the quality of the data and on analysis of data gathered. The availability of annual statistical data in the online congregation locator has enabled those interested to check in on how it goes (at least on some level) for our brothers and sisters in each place — provided they send in their data.
Congregations’ annual response to the Synod’s request for data helps tell an important aspect of the story of The Lutheran Church—Missouri Synod in time for that story to impact the work we are doing now, instead of only looking back on the work we once did. A little bit of help there — from each congregation, each year — helps us all.
The Rev. Dr. John W. Sias is secretary of The Lutheran Church—Missouri Synod. Assisting him with this commentary were staff members of the LCMS Office of Rosters, Statistics and Research Services.
Posted November 28, 2016 / Updated November 29 (This change in the fourth paragraph under the “A look at the numbers” subhead is in line with the adjustment suggested below by Al Axelson.), December 1 (The average worship-attendance figures have been removed from the bulleted list of statistics under the “A look at the numbers” subhead and included in the paragraph after that list.) and December 15, 2016.


A minor note: the phrase “Congregational membership continues its decline, but our congregations’ members seem to be increasing in frequency of attendance ….” might seem to be true by just quickly looking at the numbers. But, “average attendance” includes everyone who is attending services and not just the members. “Average attendance” would include guests and long-time attendees who aren’t on the membership roles.” It would be more “correct” to say “Congregational membership continues its decline, but the average attendance at our congregations seems to be increasing.”
Without measuring the number of non-member attendees, we don’t know if the attendance is increasing due to the members or if it’s due to the non-members.
Dear Mr. Axelson,
That is a point well taken, and illustrative both of the care that must be taken not to “overinterpret” the data we have, and of the value, perhaps, of obtaining more detailed data. While it does yet seem to me that the bulk of the variation probably has to do with members (who are generally the bulk of attendees), your wording is, indeed, the more precise.
Thank you for your careful attention to the article, and for sharing this helpful adjustment.
Is it fair to say that while average worship attendance seemed to increase from 2014 to 2015 (132 to 141), that may be because the 29% of congregations that didn’t share data in 2015 likely declined in worship attendance? (assuming that their worship attendance numbers from 2014 were also then used for 2015). Anecdotally, the congregations that don’t have good news to report statistically are less likely to report statistics.
I mention this, because the now decades-long trend of membership and worship decline seems pretty clear.
I hope I’m wrong!
Thank you for this helpful article and your service to the Church!
Dear Rev. Kelm,
Your observation, too, is a good and cautious one. That particular data item should have been qualified as you suggest: that it does not incorporate cumulative results, but reflects the subset of congregations that respond.
Is there a correlation between larger numbers and submission of numbers? It seems plausible, but who can say? Paradoxically, to be certain about that, we’d have to have all the numbers–but if we had all the numbers, we wouldn’t care!
Seriously, we do appreciate your eye for detail and will continue to strive to report accurate and timely results from the data we are given.
What followup measures are taken to try to get information from delinquent churches?
(The ones that do not initially report)
Dear Mr. Turley,
District Presidents and Circuit Visitors do work together with the Office of the Secretary and the Department of Rosters, Statistics, and Research Services to follow up with congregations that have not sent their data. Bylaws adopted by the 2016 convention make the roles of those district officials in this process even more explicit. With another year “in the books,” as they say, the time approaches for congregations to help Synod get another year “on the books.” I am sure there will be ample opportunity for reminder and encouragement, from my office and from district officials, as we enter into that process.