
By Joe Isenhower Jr.
The old saying that appearances can be deceiving might be applied to the latest financial, membership and worship-attendance statistics reported by LCMS congregations, considering the number of congregations that actually did report.
First, here is some of the latest financial and statistical information congregations reported for 2013.
A summary of reports from LCMS congregations indicates that total contributions they received in 2013 declined slightly, compared with 2012; the decline in total baptized and confirmed members for 2013 was not as steep as for 2012, and average weekly worship attendance in 2013 rose slightly.
Giving in 2013 for local expenses decreased by $4,277,703 (or .3 percent) from the figure reported for 2012, and giving for other purposes (or work at-large) rose by $622,038 (or .5). The total offerings reported for 2013 fell by only .3 percent (or $3,655,665) from 2012, to $1,419,687,164.
Baptized LCMS membership reported for 2013 declined by 33,090 (or 1.51 percent) from the number reported for 2012, for a total of 2,163,698 at the end of 2013. Confirmed membership decreased by 21,912 for 2013, to 1,685,597. A year earlier, baptized membership for 2012 declined by 35,070 compared with 2011, and confirmed membership for 2012 decreased by 24,013 from the year before.
The Synod’s Office of Rosters and Statistics annually compiles congregation-reported figures and amounts that congregations submit via an electronic form. To compile the statistics in the categories above, that office each year also uses the most recently reported figures from non-reporting congregations, regardless of the year for which they were reported.
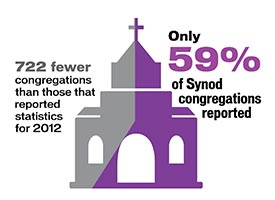
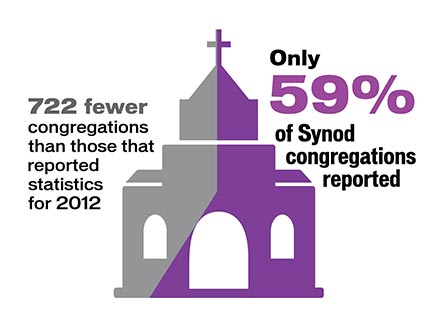
Scott Kostencki of Rosters and Statistics told Reporter that 91 percent of all LCMS congregations have reported their statistics at least once in the past three years.
However, LCMS Secretary Rev. Dr. Raymond L. Hartwig emphasized the importance of LCMS congregations reporting their statistical and financial information each year.
“Through convention actions,” Hartwig said, “our congregations have established requirements for their own membership in the Synod, including their provision of annual statistical information. They have recognized the importance of this information for the Synod’s planning of current and future ministry efforts.
“Accurate information is even more important when the Synod does its official business at its conventions,” he continued. “With only a 60 percent annual response, we can’t know for certain whether our regions are properly designated and our electoral circuits are properly formed. We must continue to work toward 100-percent participation.”
The Office of Rosters and Statistics also compiled other statistics from the reports that LCMS districts submitted during 2013.
The 35 districts reported a total of 6,136 LCMS-member congregations and new church starts at the end of 2013, compared with 6,151 a year earlier. The districts also reported the number of ordained clergymen serving in congregations was up by 41 at the end of 2013, to 5,680. Clergymen serving in other capacities at year’s end 2013 totaled 549 (14 fewer than a year earlier) and the number of retired clergymen increased by 67, to 2,813. For the end of 2012, districts reported that the number of retired clergymen had increased by 10 from 2011.
And Rosters and Statistics reported other information directly from the reports of the 59 percent of the LCMS congregations reporting for 2013. Among those compiled statistics is information indicating that all but two categories in the numbers for Sunday schools and other classes increased among congregations, with dramatic rises for weekday religion classes.
Those figures are:
- 5,106 Sunday schools (up 26 from 2012).
- 346,976 enrolled in Sunday schools (down 13,921).
- 1,375 weekday religion classes (up 45).
- 112,449 students in weekday religion classes (up 9,893).
- 21,969 non-members in weekday religion classes (up 2,267).
- 3,518 vacation Bible schools (down 58).
For 2012, all six of those Christian-education-related statistics rose, compared with figures reported for 2011.
The average attendance at weekly worship services of congregations that reported in 2013 was 154, compared with 151 for 2012.
Other increases for 2013 were in the number of “specialized ministries” reported by congregations — including the total number of 47,838 specialized ministries they conducted (up 1,006 from 2012).
They included 20,425 “educational ministries” (up 400 from 2012); 15,368 (up 306) “human-care” efforts; 7,582 (up 183) “media efforts” and 4,463 (up 117) “special-needs” ministries — for example, among those with developmental disabilities, the elderly and armed-forces personnel.
Some 491 (up 27) congregations reported offering 1,053 (up 140) “specialized worship services” in 2013. These included 348 (up 38) serving language or ethnic needs and 705 (up 102) for those who are vision- or hearing-impaired.
The numbers of “official acts” in 2013, such as baptisms and confirmations, declined when compared to those in 2012. For last year, congregations reported that:
- 21,318 (down by 3,599) children were baptized.
- 15,877 (down 2,593) teenagers were confirmed.
- 10,789 (down 3,946) adults were confirmed.
The number of “professions of faith” (“lapsed” members reinstated into congregational membership) in 2013 decreased by 1,696 (16.73 percent) to 8,442, and the number of “back-door losses” (adults removed from congregations’ membership lists for reasons other than transfer or death) decreased by 6,304 (16.67 percent), to 31,502.
The 2015 Lutheran Annual, available by year’s end from Concordia Publishing House, will include statistical information for 2013.
Posted Sept. 3, 2014 / Updated Sept. 17, 2014
